
Surendra Jauhari - SEBI RIA
Registered Office Address: GF32A, Lotus Plaza Market, Vaibhav Khand, Indirapuram, Ghaziabad -201014
Contact: 9310177272
Disclaimer: Investments in the securities market are subject to market risks. Read all the related documents carefully before investing.
Registration granted by SEBI, membership of BASL (in case of Investment Advisers) and certification from NISM in no way guarantee the performance of the intermediary or provide any assurance of returns to investors. Wealthplys is a brand owned and operated by Surendra Jauhari, SEBI Registered Investment Advisor (SEBI REG. No. INA000021474- Individual)
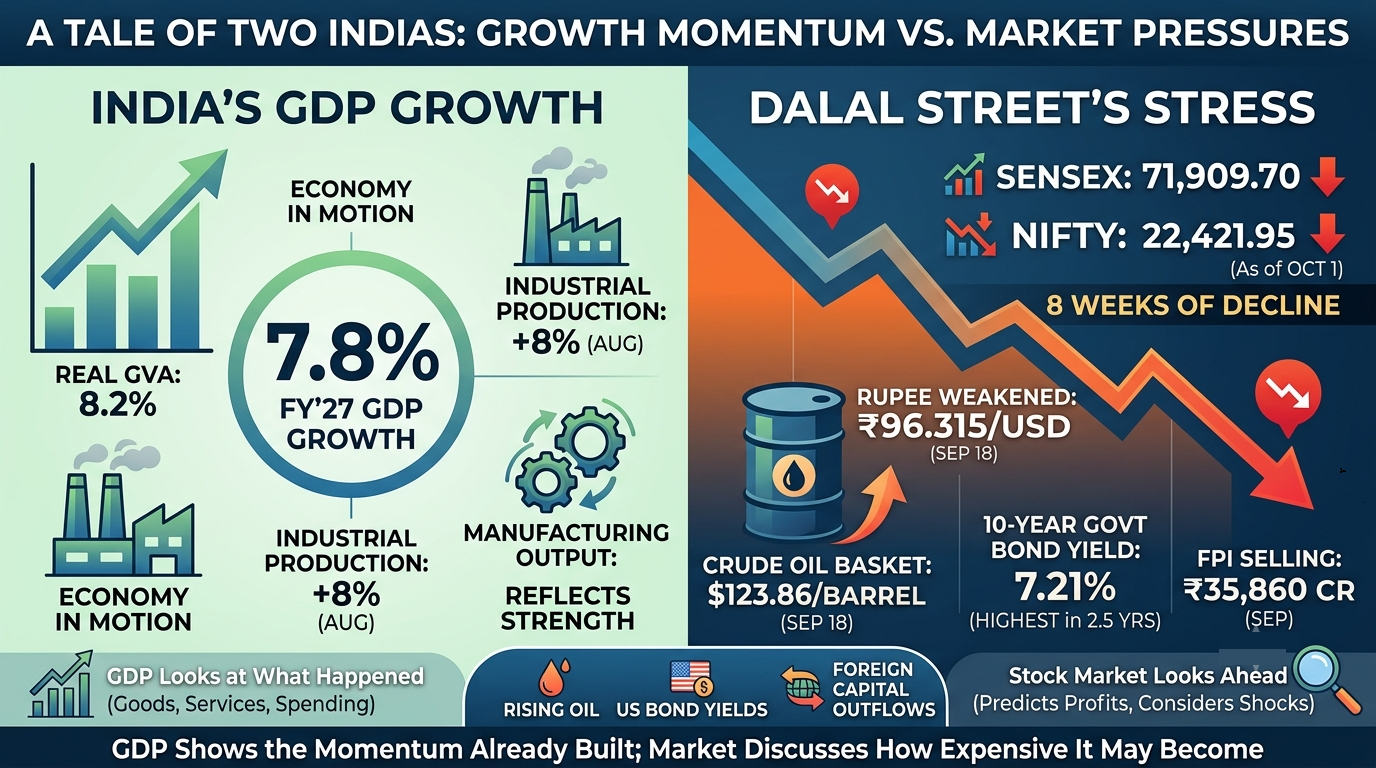
India’s GDP is growing at 7.8%. That number sounds strong. It shows the economy is moving forward. Real GVA or gross value added, grew faster at 8.2%. The data from August confirms this momentum: industrial production went up by 8% and manufacturing output rose by 9%. These are numbers that reflect an economy in motion.
Then look at Dalal Street. The stock market tells a story. By October 1 the Sensex had dropped to 71,909.70. The Nifty was at 22,421.95. Both indices had fallen for eight weeks in a row. That’s their losing streak in 25 years. The rupee weakened, hitting ₹96.315 against the US dollar. The 10-year government bond yield climbed to 7.21% the highest it has been in two-and-a-half years.
In fact, during specific market downturns, our Compounding Core Strategy-II saw a downside of only -0.78%, compared to the Nifty 500 at -4.90% and the Nifty 50 at -6.07% during the same period. That is data-backed wealth protection."
Note: Data from since 23 July, 2026 to 01st Oct, 2026
Disclaimer: The -0.78% downside pertains strictly to the proprietary track record of our Compounding Core Strategy-II during the specified period (23 July 2026 to 01 October 2026). Returns/drawdowns are presented gross of fees and expenses unless specified otherwise. Past performance is no guarantee of future results.)
So here we have two versions of India. One shows growth. The other shows stress. Why does this happen? Because GDP and the stock market measure things. GDP looks at what happened. How much goods were made. How many services were delivered. How much spending took place. The stock market doesn’t look back. It looks ahead. It tries to predict profits. It asks: How will rising oil prices affect earnings? What happens when interest rates rise? How does the exchange rate influence costs? It weighs all these factors to estimate what companies might earn next.
That is where the tension comes in. India isn’t facing one shock. It’s dealing with pressures at once. Crude oil prices are high. US bond yields are climbing. Foreign portfolio investors are selling. Each of these issues feeds into the others. It creates a chain reaction.
Let’s start with oil. A barrel of crude may seem like a topic.. It matters deeply to India. Between April and August of FY27 India imported 100.7 million tonnes of crude. Almost the same as year. The import bill jumped 48.4% to $74.8 billion. That’s not because India bought oil. It’s because the price went up.
India depends on oil for 88.1% of its energy needs. So when global prices go up the impact hits hard. Oil is priced in dollars. That means if the rupee weakens or oil goes up the cost rises over. On September 18 India’s crude basket reached $123.86 per barrel. Brent crude was at $114.82. The real cost for buyers goes higher due to currency movements.
The first impact hits refiners and fuel users. Then it spreads through the economy. Airlines end up paying more for jet fuel. Transport companies deal with logistics costs. Paint makers face rising prices for materials. Chemical producers see their input costs climb. Plastics businesses take a hit. Logistics operators feel the strain. Smaller firms often cannot pass on prices. Larger firms can shift some of the cost to customers.. Even they worry about falling demand and growing competition.
The government might respond by lowering taxes.. Delaying price increases. That changes how the cost moves through the system. It doesn’t eliminate the cost. It just shifts it around.
We see this pressure in inflation data. The Wholesale Price Index (WPI) inflation was 9.92% in August. Fuel and power inflation stood at 22.93%. Manufactured product inflation was 8.37%. The Consumer Price Index (CPI) inflation was lower at 4.82%.. Food inflation was 5.95%.
This gap tells us something. WPI inflation reflects what producers pay. CPI inflation reflects what consumers pay. They don’t move together in sync. Still they both point to rising cost pressures. These pressures are not yet fully visible in household spending. If companies absorb the cost profits shrink. If they raise prices consumers pay more. If the government steps in public finances take the hit. For now all three groups share the burden.
The Reserve Bank of India has studied this relationship using data from 2009-10 to 2023-24. Its research suggests that a 10% increase in prices could add 20 basis points to headline CPI. In one scenario sustained higher crude oil prices could lift inflation by 30 basis points. It could also reduce growth by 15 basis points. These are estimates. They depend on the value of the rupee. They depend on taxes and pricing policies. Still they show why the market watches every oil price rise.
India’s external position remains strong compared to crises. The current account deficit in the quarter of FY27 was $4.2 billion. That’s 0.5% of GDP. Within that number the merchandise trade deficit widened to $86.1 billion. That’s up from $68.9 billion a year. Net services receipts rose from $47.9 billion to $51.6 billion. They helped cover much of the gap.
India’s service sector is doing more, than supporting growth. It’s helping fund energy imports. This balance works. High oil prices leave room for comfort.
Why is the US bond causing trouble?
On September 17 the US Federal Reserve raised its target rate by 25 basis points to 3.75–4%. By October 2 the US 10-year Treasury yield touched 5.37%. Near a 24-year high.
For years investors thought emerging markets could thrive in a world where safe dollar assets offered returns. That world has changed. Now a US bond yielding than 5% makes a difference. A global investor looking at equities must ask: Is the return worth the risk after considering valuation, earnings uncertainty and possible rupee depreciation?
India’s 10-year government bond yield closed at 7.21% on October 1. That leaves a spread of 184 basis points over the US 10-year yield. This spread influences capital flows. It doesn’t decide them alone. Indian earnings, valuations, policy conditions still matter. Research from the Bank for International Settlements across 85 countries found that common global factors explain than a quarter of variation in capital flows. Still the comparison has shifted. Global capital can earn returns in dollar assets without taking equity or currency risk.
Know How Healthy Your Portfolio Really Is
Upload your mutual fund or stock portfolio and receive a free portfolio dashboard. Unlock a comprehensive audit with portfolio diagnostics, risk analysis, overlap detection, and detailed educational insights.
This pressure reaches companies too. BIS research on India shows that US monetary tightening can reduce firms’ net worth, limit credit access and affect the domestic business cycle. Not every company borrows directly in dollars. The impact still comes through banks, market yields, foreign allocations refinancing costs and the rupee.
Then the oil problem grows. Expensive crude increases India’s need for dollars. High US yields make dollar assets more attractive. FPI outflows increase foreign currency demand. A weaker rupee raises the cost of imported oil. That worsens inflation. It pushes up bond yields. This is the sequence the equity market is reacting to.
India has a defence. Foreign-exchange reserves stood at $747.557 billion as of September 25. That’s down $18.343 billion from the week. The RBI’s special facilities for FCNR(B) deposits, external commercial borrowings and overseas borrowing had mobilised $136.377 billion by August 31. Of that $127.226 billion came from FCNR(B) deposits.
This is not the situation India faced in 2013. The Reserve Bank has room to manage currency stress. It can support market conditions. Reserves help manage volatility and confidence. They don’t make oil US yields. The underlying pressure still has to work through the system.
Are foreign investors really leaving India?
FPIs sold a ₹35,860 crore of equities in September. Another ₹9,232 crore was sold on October 1. Provisional cash-market data showed foreign institutional investors sold ₹44,013 crore during September. Meanwhile domestic institutional investors bought ₹76,030 crore.
These figures cover categories. They shouldn’t be confused. But their message is clear: foreign selling has been heavy. Indian institutions have stepped in buying volumes.
This domestic buying capacity has built over ten years. Mutual fund industry assets grew from ₹15.63 lakh crore in August 2016 to ₹87.08 lakh crore in August 2026. Equity mutual funds received ₹29,328.62 crore in August. That was part of 66 months of inflows. SIP contributions reached ₹32,297 crore through 10.02 crore accounts.
This change matters. During shocks Indian markets relied heavily on foreign investors. Today regular household savings entering through funds give institutions the ability to absorb large share volumes. The ₹76,030 crore of DII purchases in September shows this happening. Not in theory. In practice.
Still the eight-week decline happened despite that buying. Domestic liquidity can meet supply. The final clearing price depends on earnings expectations, valuations, bond yields and risk appetite. SIP money has changed how India absorbs a shock. It hasn’t disconnected prices from global finance.
Investors’ behaviour reveals something than headlines suggest. From January to September they reportedly sold more than ₹3.05 lakh crore in the market. At the time they invested over ₹55,000 crore in market and IPO transactions. They kept funding selected businesses even while reducing exposure in listed stocks.
This looks like rejecting India and like a debate, over valuation. Are businesses earning enough to deserve capital? At what price? The investment logic is shifting. India still attracts long-term interest.
Has the domestic investment revolution reached every household. The SEBI Investor Survey 2025 found that 9.5% of households around 3.21 crore households participated in securities-market products although 63% were aware of least one such product. Capital preservation was the priority for 80% of households. Among investors 91% said risk and uncertainty influenced their decisions and 36% cited fear of losses caused by volatility.
These findings matter during a correction. The domestic investor base is larger and more regular than before. Its behaviour has not been tested across every kind of shock or every length of downturn. Confidence remains part of the capital-flow story.
Is this another 2013?
Every sharp fall in the rupee brings the taper tantrum back into memory. In 2013 the first signal of reduced US support triggered a 17% depreciation in the rupee by September 3. India’s reserves fell by around $17 billion and FIIs withdrew than $13.4 billion, $10.5 billion from debt and $2.8 billion, from equities. The RBI raised the standing facility rate by 200 basis points, tightened liquidity and introduced measures to address the account. By January 27 2014 the rupee had recovered 6.7% from its September level and reserves had been rebuilt.
India was punished by an event. The severity came from weaknesses at home. The external deficit and limited buffers made the country more vulnerable.
The 2022 oil shock took a path. Crude oil reached $117 per barrel after the Russia-Ukraine conflict. Indian CPI inflation hit 7.8% in April. It stayed above 6% for ten months in a row from January to October. FPIs took out $14 billion in the quarter of FY23. The rupee dropped 4%. The RBI increased rates by 250 basis points between May 2022 and February 2023. The Union Government cut excise duties on petrol and diesel. India’s real GDP still grew 7% during FY23. The equity market stayed rather strong.
March 2020 was different again. India had $16 billion of FPI outflows in one month. That was among the withdrawals at that time. The RBI acted with dollar swaps, open-market operations targeted long-term repo operations and a 100-basis-point cut in the cash reserve ratio. By FY21 FPI flows turned positive to $36.2 billion. This was led by equities. The pandemic caused panic in liquidity and in demand. Oil prices were falling of rising.
We cannot look at market symptoms like selling. Assume the same economic problem every time. In 2013 the issue was Indias position. In 2020 it was a shutdown. In 2022 it was energy and inflation. The current situation has both an energy shock and a discount-rate shock. This mix should be considered on its terms.
What is the market actually trying to tell us?
Research on the market shows that the term "oil shock" is too general. Oil-demand shocks can affect stock returns and volatility differently from supply shocks. The results also vary across banking, automobiles, metals, energy, IT, financial services and real estate. FMCG, media and pharmaceuticals do not show long-term relationships.
The index does not show these differences. For a company what matters is whether it uses energy or produces it. It also matters if costs can be passed to customers. It matters if revenues or liabilities are tied to the dollar. It matters if pricing is regulated and how often debt must be refinanced. A global macro event becomes a company-level earnings event through these questions.
The RBI expects FY27 GDP growth of 6.7% and CPI inflation of 5%. The repo rate is projected to be 5.25%. India also has an account deficit of 0.5% of GDP. Foreign-exchange reserves are above $747 billion. There is a larger domestic institutional base and growing services receipts. These are not advantages. They are the reason global turbulence does not have to become a crisis.
We should stop seeing resilience as being protected. India continues to import 88.1% of its needs. Its currency reacts to capital. Its companies compete for money in a market where US sovereign debt now gives returns. These facts exist along with the 7.8% GDP growth number. They do not go away because of it.
The stock market is not saying that India has stopped growing. It is asking a question: after paying more for oil taking a rupee and adjusting to a much higher global cost of capital how much of that growth will stay in corporate earnings?
That is why the economy can look strong and Dalal Street can still be worried. The GDP data show the momentum India has already built. The market correction is a discussion, about how expensive that momentum might become.